TL;DR
We studied 1500 generated answers to see how answer engine optimization works in reality. We found that securing the top source controls what the model writes first, but it does not force identical outputs. Winning top placement gets you credit without locking the artificial intelligence into a single narrative.
The hypothesis
Founders and marketing leaders need to know if holding the top spot forces the model to copy their exact story. We tested two main ideas to understand this behavior.
Our first idea checked if answers sharing the top source look identical.
Another idea tested if that top source controls specific sections inside the text.
Why this matters
Search is changing fast. Answer engine optimization focuses on getting your content understood and surfaced by artificial intelligence. Generative engine optimisation improves your representation inside chat answers.
A system connects an external database to the language model so it can retrieve facts before writing. You will miss what actually drives the output if your tracking software only looks at link placement.
Data science helps us separate who gets cited from what the user eventually sees.
The methodology
We built a dataset of 1500 generated responses. These responses contained 3797 grounding rows from 1171 unique sources. Our team split every generated answer into smaller sections. We then divided the original sources into text chunks.
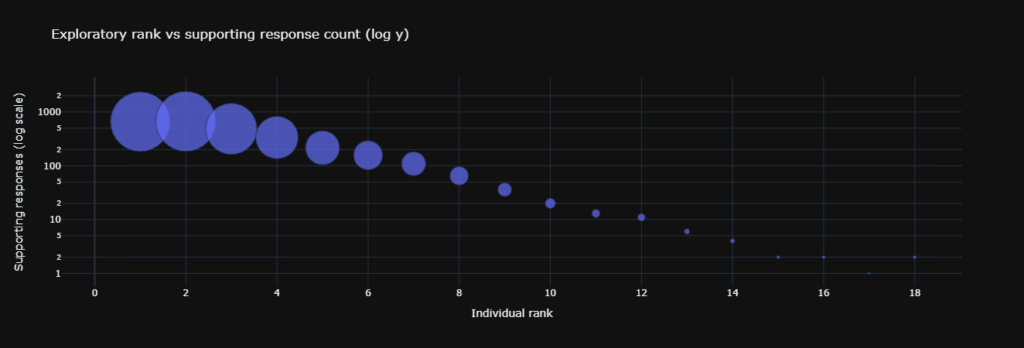
The researchers embedded both parts and matched the sections to the closest chunks using mathematical distance. We tracked citation counts to see where the model paid attention. The top spot received 1171 citations, while the tenth spot only received 23 citations.
Statistical approach
Our team used bootstrap confidence intervals with 2000 resamples. This method estimates uncertainty without assuming our data follows a normal curve. Researchers also ran permutation tests with 3000 shuffles.
This created a clean baseline to show what happens if we mix up all the source labels randomly. The final report included the effect size so your business decisions rely on actual impact rather than simple probability scores.
Key findings
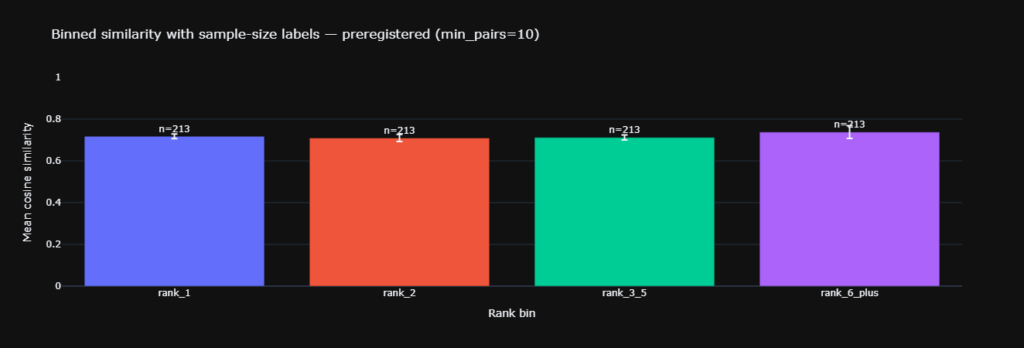
The first test showed no support for identical outputs.
- Similarity scored 0.717 for the top shared pairs and 0.712 for lower shared pairs.
2. The second test proved the top source dominates internal sections. Top influence share reached 0.38 compared to a 0.25 baseline.
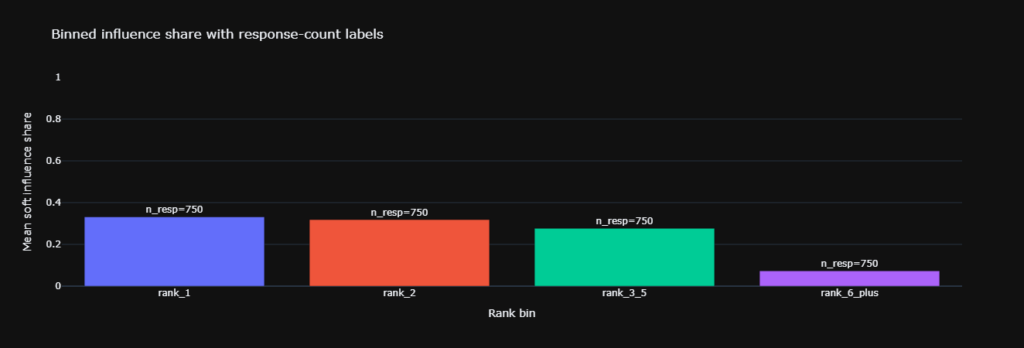
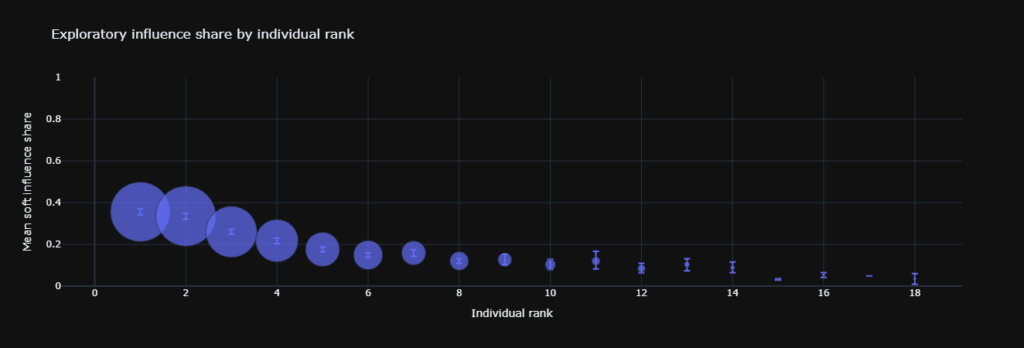
3. Top influence drops significantly as you move down the list.
4. The amount of available data falls fast beyond the first few positions.
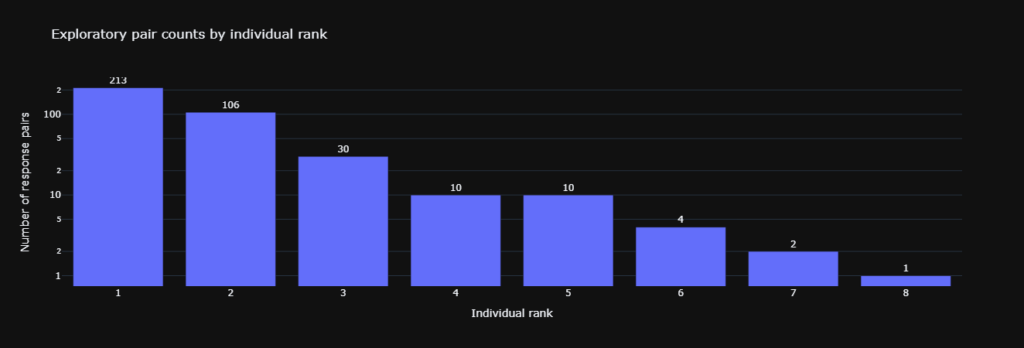
5. Citation counts show a steep drop in model attention.
Impact on results
Looking only at citation counts makes you think this process is just a simple race to the top. Influence share metrics and shuffle tests change that perspective completely. The top spot dominates the internal structure of the text.
However, that shared source does not make the final answers converge across different prompts. This provides a cleaner way to evaluate artificial intelligence behavior.
We can finally separate internal attribution from external similarity.
What this means for you
You should aim for the top position whenever possible. That first spot tends to anchor the early sections of the generated text. Teams must also cover the next few positions with specific pages.
The model blends multiple sources together so cross answer similarity stays diverse. Use data science to track influence share by web address.
Tune your AEO tool to report both retrieval rate and section influence. Add intent mapping to your testing process.
Check which intents show up as influential chunks across the final output.
Key Terms Glossary
- Cosine similarity is a score that measures how close two embedding vectors point.
- Bootstrap confidence interval is a range built by resampling the observed data many times.
- Permutation test is a shuffle based test that compares the observed effect to effects from randomized labels.
- Cohen d is an effect size that expresses mean differences in standard deviation units.
- Null model is a baseline world used for comparison.
Frequently asked questions
FAQ 1
Does the top spot make artificial intelligence answers the same.
No, because similarity remains flat across different ranks.
FAQ 2
Does the top spot still matter for answer engine optimization.
Yes, because it shapes many sections inside the generated text.
FAQ 3
What should my team measure in their tracking software.
Track retrieval by position and influence share by web address.
FAQ 4
How do I explain this to a non technical team.
The top source sets the opening and gets most of the credit, but the full answer still changes with the prompt.
FAQ 5
Where does intent mapping fit into this process.
Use it to define the questions you want to own and measure if those intents appear in influential sections.
Summary
The top rank wins influence inside answers without forcing sameness, so your strategy should pair ranking work with section level measurement.
Follow Kojable for more deep dives
Leave a Reply