Category: AI Model Analysis

Insights from your ongoing experiments with autonomous crawlers and model behavior.

  • Positional Bias and Entity Extraction for AEO in SEO

    TL;DR: The Business Bottom Line

    Mastering AEO in SEO requires isolating the exact mathematical relationship between your native search rank and how generative engines extract your brand data.

    • The Core Reality: Ranking first on traditional search engine results pages guarantees the artificial intelligence models will ingest your factual data, but it mathematically fails to guarantee an explicit product recommendation.
    • The Revenue/Visibility Impact: Securing the top search position increases factual entity visibility by 4.3 percent over lower results, yet the explicit endorsement rate remains entirely flat across the top five search positions.
    • The Strategic Pivot: Marketing leaders must split their search strategy into distinct factual indexing and product endorsement tracks, shifting resources to secure placements within highly ranked software blogs over lower ranking legacy institutional sites.

    Note: The remainder of this report details the exact statistical methodology, causal inference models, and raw data used to reach these conclusions. It is written for data scientists, machine learning engineers, and technical search professionals.


    The Core Problem & Hypotheses

    As Generative AI systems mediate information retrieval, search visibility metrics require strict empirical reevaluation. We tested whether a high native search rank compels a Large Language Model to extract entities or recommend products at a higher frequency.

    We pre-registered and tested two formal hypotheses within a Google Vertex AI Search configuration:

    H2A (Factual Extraction): Generative AI architectures enforce a positional bias during extraction, such that $P(\text{extracted} \mid \text{Rank 1}) > P(\text{extracted} \mid \text{Rank } k)$, where $k$ represents lower ranked evidence.

    H2B (Recommendation Propensity): Entities sourced from Rank 1 hold a statistically higher probability of explicit recommendation, such that $P(\text{recommended} \mid \text{Rank 1}) > P(\text{recommended} \mid \text{Rank 3 to 5})$, controlling for source text brand density.

    Experimental Setup & Methodology

    Data aggregation relied on grounded conversational outputs across thousands of financial logic queries. To ensure tracking accuracy, we enforced a strict Closed-World Assumption. The pipeline mapped evidence URLs to canonical domains and tracked only the entities strictly traceable to the provided grounding sources.

    We evaluated entity extraction using a robust four layer funnel to prevent false negatives:

    • Regex Matching: Exact string matching of brand names in the generated response.
    • spaCy NER: Implementation of the en_core_web_sm model with a custom EntityRuler injected with a specialized brand dictionary to capture ORG and PRODUCT classifications.
    • Dictionary Lookup: Mapping localized product strings back to their parent canonical domains.
    • LLM Implicit Extraction: A fallback evaluation using gemini-3.1-pro-preview to identify implicit non-named entity references based strictly on context.

    To prevent confounding variables where top pages simply repeat their brand names to manipulate extraction, we engineered a Position-Weighted Brand Density control.

    Mentions of an entity in the first 20% of the text received a 2.0x weight, and mentions in the top 50% received a 1.5x weight.

    Isolating the Variables: Our Statistical Approach

    We applied causal inference models to isolate the genuine effect of ranking position over simple correlation.

    We corrected all final outputs for multiple hypothesis testing using the Benjamini-Hochberg procedure.

    Statistical TestVariable IsolatedRationale for Selection
    Logistic RegressionPosition-Weighted Brand DensityResidualizes hit rates by modeling $P(\text{mentioned} \mid \text{rank, brand\_density, cluster, intent})$.
    Cluster-Aware Block PermutationQuery-Level VarianceShuffles rank labels strictly within identical query clusters to account for localized intent variance.
    Propensity Score Matching (PSM) & IPWCausal Effect of PositionIsolates the causal effect of search ranking position from confounding text variables.

    Key Empirical Findings for AEO in SEO

    Finding 1: The Positional Bias in Factual Extraction (H2A)

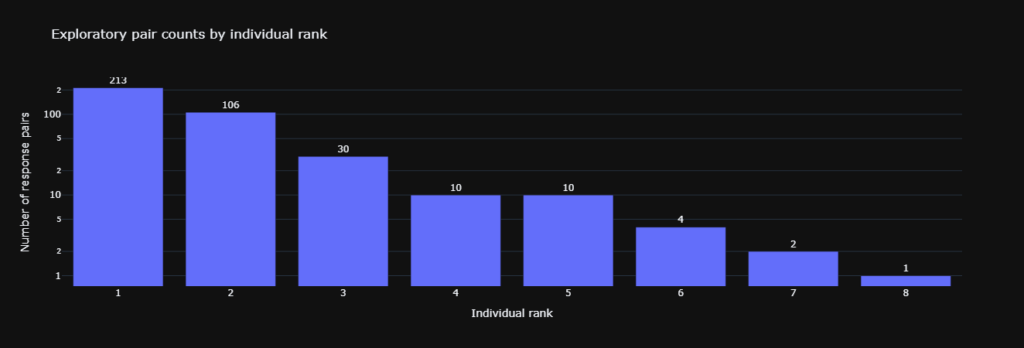
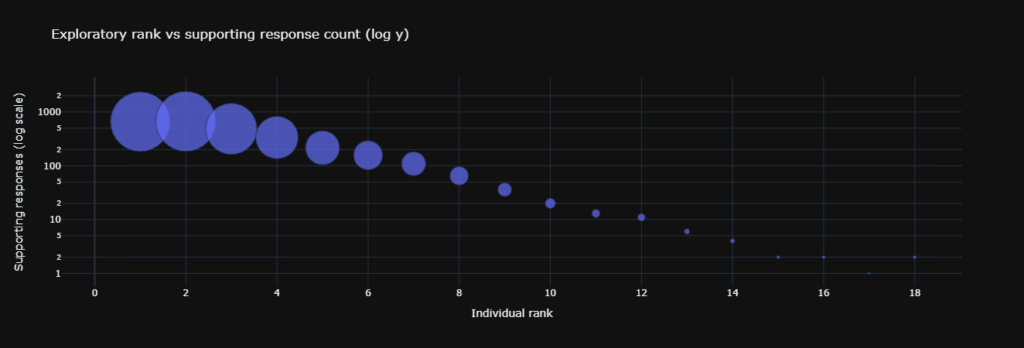
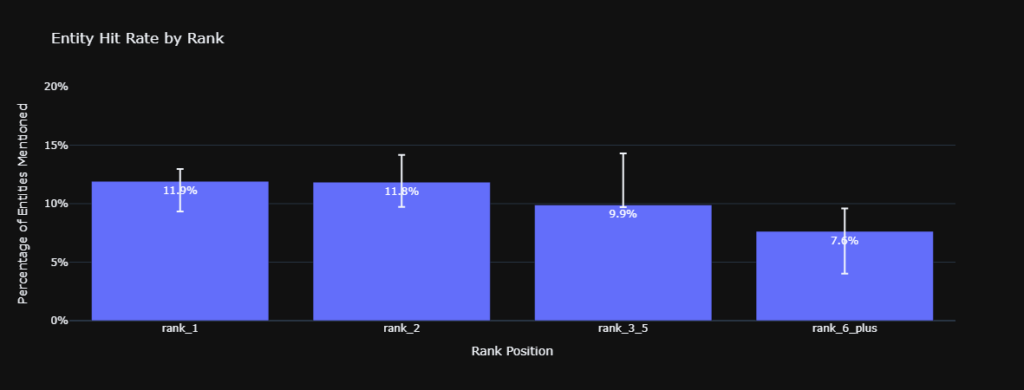
    Analysis of the raw and controlled entity hit rates confirms a severe rank gradient for factual ingestion. The raw hit rate for Rank 1 sources sits at 11.9% ($n = 1645$).

    This decays sequentially.

    Rank 2 sits at 11.8% ($n = 1233$), Rank 3 through 5 falls to 9.9% ($n = 1840$), and Rank 6 and above drops to 7.6% ($n = 720$).

    Applying the logistic control yields a 12.5% controlled hit rate for Rank 1 versus 8.5% for Rank 6 and above.

    The 95% Confidence Intervals for Rank 1 [9.3%, 12.9%] and Rank 6 and above [4.0%, 9.6%] do not overlap.

    This demonstrates robust statistical significance and supports H2A.

    Document level AEO in SEO entity hit rate by source rank bin demonstrating positional bias.
    Document-level Entity Hit Rate by Source Rank Bin. Error bars denote 95% Confidence Intervals for the sample means, demonstrating non-overlapping variance between top positions and lower tiers.

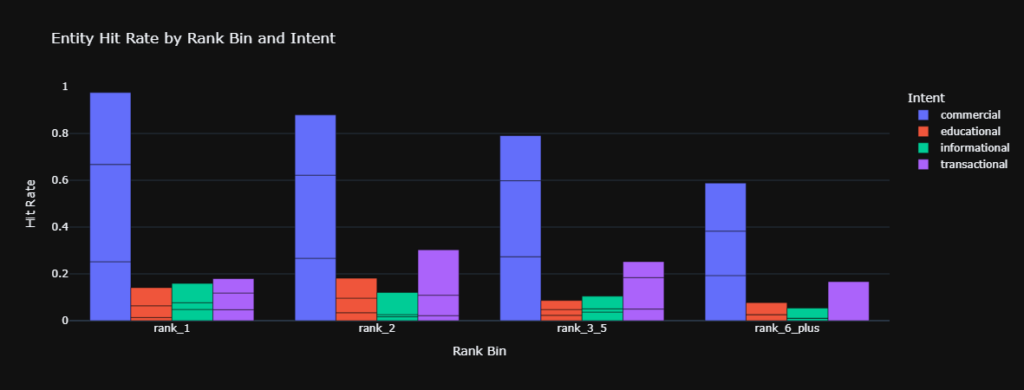
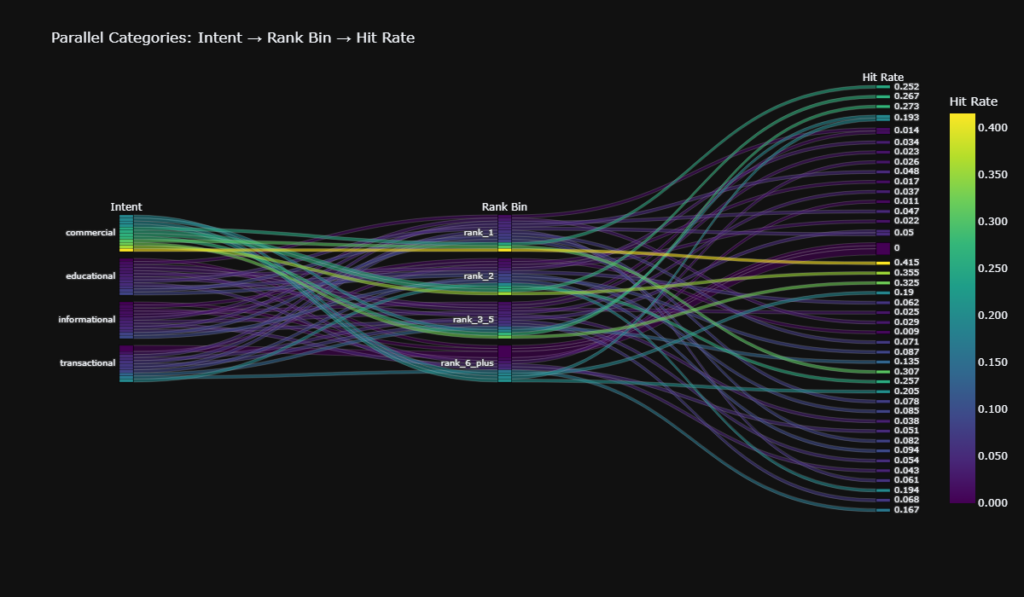
    Finding 2: Intent Context Alters Positional Bias for AEO in SEO

    Stratification of the dataset reveals that user intent contextually overrides positional bias. Within the commercial cash_flow cluster, Rank 1 achieved a 25.2% hit rate.

    However, Rank 2 achieved 26.6%, and Ranks 3 through 5 secured 27.3%. In high-value commercial evaluations, the LLM actively diversifies its sourcing across the primary search window, displaying contextual rank agnosticism.

    Grouped bar chart tracking AEO in SEO entity hit rate across rank bins stratified by user intent
    Grouped bar chart tracking Entity Hit Rate across Rank Bins, stratified by User Intent. The data illustrates how commercial intents disrupt the standard rank decay curve for AEO in SEO.
    Parallel categories plot visualizing commercial query flow and AEO in SEO extraction density.
    Parallel Categories plot visualizing the commercial flow, depicting high density hit rates converging tightly across Ranks 1 through 5

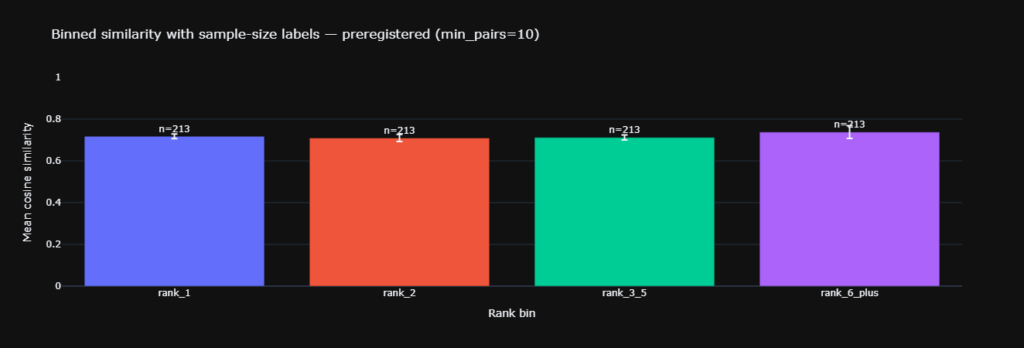
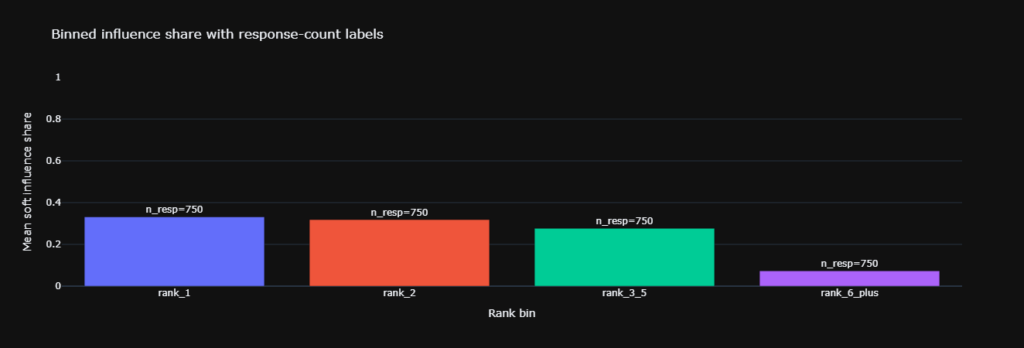
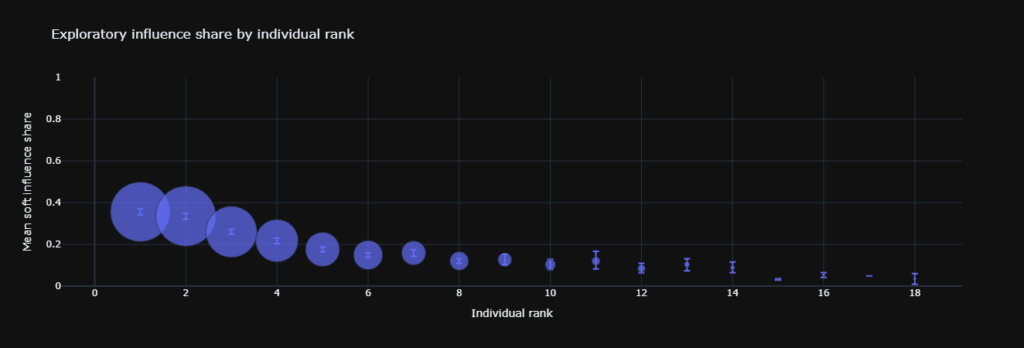
    Finding 3: The Decoupling of Recommendation Propensity (H2B)

    We utilized a zero-temperature LLM prompt requiring JSON output to map recommended entities to exact sections and text quotes.

    This tested whether factual extraction translates into explicit recommendation propensity for AEO in SEO.

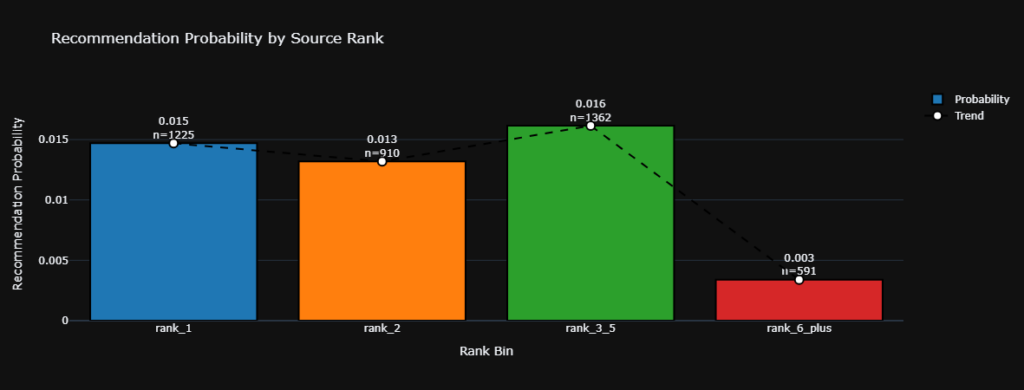
    The probability metric $P(\text{recommended} \mid \text{rank})$ is non-monotonic and structurally low:

    • Rank 1: 0.015 ($n = 1225$)
    • Rank 2: 0.013 ($n = 910$)
    • Rank 3 through 5: 0.016 ($n = 1362$)
    • Rank 6 and above: 0.003 ($n = 591$)

    A two-tailed T-test comparing Rank 1 and the Rank 3 through 5 cluster yielded a p-value of 0.571. This establishes no statistical difference. Search position does not reliably scale recommendation likelihood, meaning H2B is not supported.

    Recommendation probability by rank bar and scatter plot showing decoupling of rank and endorsement for AEO in SEO.
    Bar and scatter plot visualizing Recommendation Probability by Rank. The non-monotonic trend line illustrates the decoupling of search rank from the propensity to explicitly recommend an entity.

    Structural Impact

    The data exposes an Authority Erosion Effect native to LLM grounding mechanisms. The mean textual brand density measured 3.96 for Rank 1 sources, while Rank 6 and above sources exhibited the highest density at 4.31.

    A qualitative domain audit revealed Rank 1 is heavily populated by agile B2B software domains, whereas Rank 6 and above contains macro-financial institutions.

    Because the generative model enforces positional bias, it systematically ingests narratives from Rank 1 domains.

    This effectively circumvents the traditional extrinsic domain authority of the legacy institutions natively populating the lower ranks.

    Technical Glossary (Entity Mapping)

    • Closed-World Assumption: A strict data boundary premise where entity tracking is limited exclusively to the specific entities present within the provided grounding URLs.
    • Position-Weighted Brand Density: A statistical control metric that assigns mathematical weight multipliers to brand mentions based on their proximity to the beginning of a document.
    • Propensity Score Matching (PSM): A matching technique used to estimate the causal effect of a treatment by accounting for covariates that predict receiving the treatment.
    • Cluster-Aware Block Permutation: A variance control method that shuffles rank labels strictly within identical query clusters to isolate local intent effects.
    • Benjamini-Hochberg Procedure: A statistical method for controlling the false discovery rate during multiple hypothesis testing to ensure p-values reflect true significance.
    • Zero-Temperature Prompt: A deterministic Large Language Model parameter setting that forces the model to select the most probable token, eliminating creative variance during extraction.
    • Inverse Probability Weighting (IPW): A technique used to calculate statistics standardized to a pseudo-population to adjust for confounding variables in observational data.

    Frequently Asked Questions

    Q: How does search rank causally affect AEO in SEO?

    A: Search rank dictates the probability of factual extraction by generative models, creating a measurable mathematical bias toward the first position over lower results.

    Q: Does a top ranking statistically guarantee an AI brand recommendation?

    A: No, empirical data shows recommendation probability remains flat across ranks one through five, confirming a p-value of 0.571 and no statistical advantage.

    Q: What is the Authority Erosion Effect structurally?

    A: It is a phenomenon where generative models prioritize factual extraction from highly optimized software domains ranking first, circumventing the native authority of lower ranking legacy institutions.

    Q: Why did the study calculate position-weighted brand density?

    A: This metric controls for confounding variables where top ranking pages might artificially inflate their extraction rates by repeating their brand name more frequently than lower pages.

    Q: How do commercial intents alter baseline entity extraction rates?

    A: High-value commercial queries cause the language model to diversify its context window, flattening the positional bias across the top five search results.

    Q: What does a p-value of 0.571 prove regarding recommendation propensity?

    A: It confirms that the minor variances in recommendation rates between the first position and positions three through five are strictly due to random chance, not rank position.

      Conclusion

      The empirical data confirms that generative retrieval architectures actively enforce a positional bias during factual extraction, granting a statistically significant advantage to Rank 1 sources. However, rigorous causal inference testing reveals this positional bias fails to cascade into recommendation propensity. Search rank serves strictly as a gatekeeper for factual entity ingestion, operating completely independently of the underlying mathematical logic the model utilizes for explicit brand endorsement.

      Kojable

      Kojable tracks how artificial intelligence models cite brands across different user personas and commercial intent clusters. If you are optimizing for AI search, we can show you exactly how your content performs in live retrieval.

    1. The Answer Engine Optimization Rank 1 Myth

      TL;DR

      We studied 1500 generated answers to see how answer engine optimization works in reality. We found that securing the top source controls what the model writes first, but it does not force identical outputs. Winning top placement gets you credit without locking the artificial intelligence into a single narrative.

      The hypothesis

      Founders and marketing leaders need to know if holding the top spot forces the model to copy their exact story. We tested two main ideas to understand this behavior.

      Our first idea checked if answers sharing the top source look identical.

      Another idea tested if that top source controls specific sections inside the text.

      Why this matters

      Search is changing fast. Answer engine optimization focuses on getting your content understood and surfaced by artificial intelligence. Generative engine optimisation improves your representation inside chat answers.

      A system connects an external database to the language model so it can retrieve facts before writing. You will miss what actually drives the output if your tracking software only looks at link placement.

      Data science helps us separate who gets cited from what the user eventually sees.

      The methodology

      We built a dataset of 1500 generated responses. These responses contained 3797 grounding rows from 1171 unique sources. Our team split every generated answer into smaller sections. We then divided the original sources into text chunks.

      The researchers embedded both parts and matched the sections to the closest chunks using mathematical distance. We tracked citation counts to see where the model paid attention. The top spot received 1171 citations, while the tenth spot only received 23 citations.

      Statistical approach

      Our team used bootstrap confidence intervals with 2000 resamples. This method estimates uncertainty without assuming our data follows a normal curve. Researchers also ran permutation tests with 3000 shuffles.

      This created a clean baseline to show what happens if we mix up all the source labels randomly. The final report included the effect size so your business decisions rely on actual impact rather than simple probability scores.

      Key findings

      The first test showed no support for identical outputs.

      1. Similarity scored 0.717 for the top shared pairs and 0.712 for lower shared pairs.
      Bar chart with Rank 1 and Rank 3 to 5 bars at nearly the same height illustrating answer engine optimization.
      Cross response similarity stays almost flat across shared source rank bins.

      2. The second test proved the top source dominates internal sections. Top influence share reached 0.38 compared to a 0.25 baseline.

      Bar chart where Rank 1 is tallest and Rank 6 plus is smallest showing answer engine optimization impact.
      Within one answer Rank 1 wins a larger share of section influence than any other bin.

      3. Top influence drops significantly as you move down the list.

      Scatter plot with larger points at low ranks and smaller points at high ranks for answer engine optimization analysis.
      Mean influence share declines as rank increases.

      4. The amount of available data falls fast beyond the first few positions.

      Bar chart with a tall bar at Rank 1 and much shorter bars by Rank 8.
      The number of response pairs per shared rank drops sharply after the first few ranks.

      5. Citation counts show a steep drop in model attention.

      Bubble chart on a log scale where bubbles shrink as rank increases.
      Supporting response counts drop as rank increases showing top heavy citing behavior.

      Impact on results

      Looking only at citation counts makes you think this process is just a simple race to the top. Influence share metrics and shuffle tests change that perspective completely. The top spot dominates the internal structure of the text.

      However, that shared source does not make the final answers converge across different prompts. This provides a cleaner way to evaluate artificial intelligence behavior.

      We can finally separate internal attribution from external similarity.

      What this means for you

      You should aim for the top position whenever possible. That first spot tends to anchor the early sections of the generated text. Teams must also cover the next few positions with specific pages.

      The model blends multiple sources together so cross answer similarity stays diverse. Use data science to track influence share by web address.

      Tune your AEO tool to report both retrieval rate and section influence. Add intent mapping to your testing process.

      Check which intents show up as influential chunks across the final output.

      Key Terms Glossary

      • Cosine similarity is a score that measures how close two embedding vectors point.
      • Bootstrap confidence interval is a range built by resampling the observed data many times.
      • Permutation test is a shuffle based test that compares the observed effect to effects from randomized labels.
      • Cohen d is an effect size that expresses mean differences in standard deviation units.
      • Null model is a baseline world used for comparison.

      Frequently asked questions

      FAQ 1

      Does the top spot make artificial intelligence answers the same.

      No, because similarity remains flat across different ranks.

      FAQ 2

      Does the top spot still matter for answer engine optimization.

      Yes, because it shapes many sections inside the generated text.

      FAQ 3

      What should my team measure in their tracking software.

      Track retrieval by position and influence share by web address.

      FAQ 4

      How do I explain this to a non technical team.

      The top source sets the opening and gets most of the credit, but the full answer still changes with the prompt.

      FAQ 5

      Where does intent mapping fit into this process.

      Use it to define the questions you want to own and measure if those intents appear in influential sections.

      Summary

      The top rank wins influence inside answers without forcing sameness, so your strategy should pair ranking work with section level measurement.

      Follow Kojable for more deep dives

    2. AI Search Personalization: Do Results Actually Vary by Professional Role?

      Quick Answer: Yes, but the impact is strategic rather than overwhelming. AI does personalize search results based on professional roles, but it’s just one piece of the puzzle.

      • The Takeaway: Highly operational roles (like AR and AP managers) get highly tailored AI responses, whereas generalist roles (like finance analysts) receive much more generic outputs.
      • The Data: In a blocked permutation test of 988 finance prompts, we found effect sizes ranging from Cohen’s d = 0.48 to 0.95.
      • The Reality Check: While 72% of this personalization survives even when we strip out role-specific jargon, persona only accounts for about 5% of the total response variance. Intent, topic, and industry context are still the heaviest hitters.

      What This Research Examined

      We tested whether AI search engines genuinely adapt content to professional personas or simply echo job titles back. Specifically: when a CFO and an AR manager both search for cash flow guidance with the same underlying intent, does the AI produce substantively different answers?

      Sample: 988 prompts across 12 B2B finance personas (~82 per role) Method: Blocked permutation tests with vocabulary ablation controls Significance: All findings p < 0.002 unless noted


      Key Findings: AI Persona Personalization by the Numbers

      FindingMetricInterpretation
      Persona-response correlationr = 0.22 (r² = 0.048)Small-to-medium effect; 5% variance explained
      Within-persona similarity premium+0.062 cosine similarityResponses to same role cluster measurably
      Effect after jargon removal72% of signal survivesSubstantive adaptation, not vocabulary echoing
      Strongest persona effectCohen’s d = 0.95 (AR manager)Very large differentiation
      Weakest persona effectCohen’s d = 0.48 (finance analyst)Medium effect; overlaps with other roles

      Confidence intervals: ±0.16 for Cohen’s d estimates (95% level)

      Figure 1: Persona Coverage Index. The upward slopes confirm that AI responses generated for the identical persona (Within Persona) have measurably higher cosine similarity than those generated across different personas (Cross Persona).

      Does AI Actually Change Content or Just Word Choice?

      Common misconception: AI personalization is cosmetic—swapping job titles while delivering identical advice.

      Reality: Ablation testing proves substantive adaptation.

      We mathematically stripped all role names, industry jargon (“collections velocity,” “covenant compliance”), and professional vocabulary from responses, then re-measured similarity. The persona signal dropped 28%—from +0.062 to +0.045—but remained statistically significant (p = 0.002).

      What this means: The AI alters advice structure, prioritization, and strategic framing based on role context, not just surface language.

      Figure 2: Persona Effect Sizes (Original vs. Ablated). While removing role-specific vocabulary reduces the distinction, ~72% of the effect size remains intact, proving the AI alters substantive advice.

      Which Finance Roles Trigger the Most Distinctive AI Responses?

      Not all personas receive equal AI differentiation. Operational and risk-focused roles show strongest signal; generalist roles blur together.

      Figure 3: Original Distinctiveness vs. Ablation Impact. Operational roles like AR Managers show high distinctiveness but rely heavily on jargon, whereas strategic roles like Founders maintain distinctiveness through broader strategic framing.

      High-Differentiation Roles (Cohen’s d > 0.75)

      RoleOriginal dAblated dWhy Distinctive
      AR manager0.95 [0.63, 1.27]0.68Specific operational metrics (DSO, collection targets)
      Payments ops lead0.81 [0.50, 1.14]0.65Technical payment systems focus
      Founder0.78 [0.46, 1.10]0.62Strategic/growth framing vs. operational
      AP manager0.78 [0.46, 1.10]0.48Vendor management, cash timing priorities

      Moderate-Differentiation Roles (Cohen’s d 0.50–0.75)

      • CFO, FP&A lead, compliance officer, internal auditor, finance ops manager, revops lead, and Treasury manager*.

      Low-Differentiation Role (Cohen’s d < 0.50)

      • Finance analyst: d = 0.48 [0.16, 0.80] original, 0.28 ablated

      Strategic implication: If your ICP is a finance analyst, persona-based AEO optimization delivers weak returns. Invest in industry vertical and use-case differentiation instead.

      *Note on Treasury Managers: While their final text responses show moderate differentiation, they actually trigger the highest distinctiveness of any role in backend search behavior (Query Fan-Out d = 0.95)**. The AI searches the web completely differently for them, even if the final text output is more constrained.


      How Does AI Tone Change for Different Finance Roles?

      Beyond content structure, AI adapts communication register measurably:

      FeatureLowestHighestPattern
      FormalityFounder (13.8)AP manager (16.1)Operations roles get formal register
      Analytical densityCompliance officer (4.0)FP&A lead (7.0)Planning roles get data-heavy content
      Urgency framingFounder (0.53)Compliance officer (1.13)Risk roles get alarm language
      SentimentCompliance officer (0.23)Finance analyst (0.67)Risk-averse roles get negative tone
      Directive voiceFounder (0.65)Internal auditor (1.04)Audit roles get imperative instructions

      Statistical basis: Kruskal-Wallis H-tests, p < 0.05 with Bonferroni correction; effect sizes small-to-medium (η² = 0.06–0.12)

      Figure 4: Voice Fingerprints for Top 4 Distinctive Personas. The AI adopts entirely different structural shapes for different roles, heavily over-indexing on Urgency for Compliance Officers and Directive language for Internal Auditors.
      Figure 5: Sentiment Distribution by Persona. Risk-averse roles (Compliance, Finance Ops) trigger wide, negative sentiment spreads, while generalist roles (Finance Analyst) remain tightly clustered and neutral.

      Do AI Search Queries Differ by Persona Too?

      AI search engines don’t just generate different answers—they execute different background searches depending on who’s asking.

      Query fan-out similarity results:

      • Original queries: +0.054 within-persona gap (p = 0.002), r = 0.23
      • Ablated queries: +0.036 gap survives (p = 0.002)
      Figure 6: Fan-Out Query Similarity Heatmap. The bright yellow diagonal line proves that the AI formulates highly similar background search queries when the persona is identical.

      Translation: The AI reformulates search queries differently for different roles, retrieving distinct source material before generating responses. This suggests persona adaptation occurs at the retrieval layer, not just generation.


      3 AEO Tactics Based on This Research

      1. Prioritize Operational Roles for Persona Targeting

      AR managers, AP managers, and payments ops leads trigger the strongest AI differentiation. Build dedicated content streams for these roles with specific operational metrics and workflow context.

      2. Use Industry/Use-Case Differentiation for Generalists

      Finance analysts show weak persona signal. Instead of role-based content, target this ICP through industry vertical expertise (SaaS financial operations, healthcare revenue cycle) and specific use cases (month-end close automation, board reporting).

      3. Match Register to Role Expectations

      AI adapts tone significantly by persona. Your content should mirror:

      • Formal, analytical register for FP&A and treasury
      • Urgent, risk-aware framing for compliance and audit
      • Collaborative, strategic tone for founders and CFOs
      Figure 7: Normalized Heatmap of Sentiment, Tone & Voice. A visual guide for AEO: match your content’s register to the dark red (over-indexed) and dark blue (under-indexed) areas the AI expects for your target persona.

      How to Optimize Content for AI Persona Targeting

      Do:

      • Include specific operational metrics relevant to the role (DSO for AR, days payable outstanding for AP)
      • Structure content around role-specific priorities (runway protection for CFOs, retention balance for AR managers)
      • Use industry-standard terminology naturally—AI recognizes professional vocabulary as context signals

      Don’t:

      • Over-optimize for generic “finance” personas—weak differentiation signal
      • Rely solely on job title mentions—72% of effect is substantive
      • Ignore confidence intervals—finance analyst targeting shows high uncertainty (d = 0.48 ± 0.32)

      Methodology: How We Measured AI Persona Effects

      ComponentSpecification
      Sample size988 responses
      Personas12 B2B finance roles
      Topic clustersCash flow, payment processing, fraud detection
      Statistical testBlocked permutation test (persona shuffled within topic×intent blocks)
      Permutations500 overall, 200 per persona
      Ablation methodRegex removal of role vocabulary, names, jargon; re-embedding
      Similarity metricCosine similarity (OpenAI text-embedding-3-small)
      Tone analysisVADER (sentiment), Flesch-Kincaid (grade level), keyword density, imperative/modal ratios
      Significance testingPermutation p-values, Kruskal-Wallis H-tests with Bonferroni correction

      Limitations: Confidence intervals estimated via standard error approximation; individual persona samples (~82 responses) limit precision for smaller effects; query fan-out infers search behavior from query similarity rather than direct search log access.


      Bottom Line for AEO Strategy

      AI search engines do treat professional personas differently—but the effect is strategically meaningful, not dominant. Persona explains roughly 5% of response variance, with 72% of that signal coming from substantive content adaptation rather than vocabulary matching.

      High-confidence targeting: Operational finance roles (AR, AP, payments, treasury) Low-confidence targeting: Generalist roles (finance analyst) Primary optimization priority: Topic relevance and intent alignment remain more important than persona tailoring


      Research Context

      Research by: Kojable
      Tools: Google Gemini (grounding), OpenAI Embeddings, Python (NumPy, SciPy, Plotly, VADER)


      Key Terms: Understanding the Data

      To fully grasp how AI adapts to different personas, it helps to understand the statistical methods used to measure it. Here is how we define our core metrics:

      • Ablation (in AI Prompt Testing): In natural language processing, ablation is the process of intentionally removing specific variables to see how the system’s output changes. In this study, ablation meant mathematically stripping all role names, job titles, and industry jargon (e.g., “collections velocity”) from the AI’s responses. This allowed us to measure if the AI was actually changing its underlying advice, or just echoing back vocabulary.
      • Cohen’s d (Effect Size): Cohen’s d is a statistical metric used to measure the standardized size of a difference between two groups. In the context of Answer Engine Optimization, it tells us how intensely the AI differentiates its answers for a specific role. A score below $0.5$ is a weak/medium effect, while a score above $0.8$ (like the AR Manager’s $d = 0.95$) represents a massive, highly distinct variation in how the AI treats that persona.
      • Blocked Permutation Test: A rigorous statistical test used to prevent false positives. Instead of just scrambling all the data randomly, we shuffled the persona labels only within their specific topic and intent categories. This ensures that any differences we found were strictly driven by the persona, not because the AI was answering a completely different type of question.
      • Cosine Similarity: A metric used to measure how semantically similar two pieces of text are, regardless of their length. We used OpenAI embeddings to calculate the cosine similarity of the AI’s responses, proving mathematically that responses generated for the exact same persona cluster closer together than responses for different personas.

      Related Questions

      How much of AI personalization is real versus vocabulary echoing? 72% of persona signal survives complete vocabulary ablation, proving the AI adapts substantive advice structure, not just word choice.

      Which B2B roles trigger the most distinctive AI search results? Operational specialists (AR managers, payments ops leads) show very large effect sizes (d > 0.8). Strategic roles (CFOs, founders) show medium-large effects. Generalists (finance analysts) show weak, uncertain differentiation.

      Is persona-based content optimization worth the investment? Yes for operational roles with specific workflows and metrics; no for generalist roles where industry and use-case targeting outperforms persona targeting.

    3. The Reddit Myth in Fintech: Why AI SEO is not one-size-fits-all

      If you’re a fintech marketer, you’ve probably heard the advice: “Get active on Reddit to show up in AI search results.”

      Our data says that’s wasted effort. Here’s why.

      The “Reddit Everywhere” Myth

      If you follow Generative Engine Optimization (GEO), you’ve seen the narrative: User-Generated Content platforms dominate AI citations. Studies from Profound, Semrush, and BrightEdge show Reddit and YouTube command 20–40% of Google AI Overview citations.

      For broad consumer questions, that’s true. For fintech? The data tells a completely different story.

      The Fintech GEO Study: When Money Moves, AI Gets Serious

      We analyzed how Google Gemini actually cites sources in fintech—where regulatory compliance, security, and technical accuracy matter.

      The dataset:

      The results upend the conventional wisdom.

      Authority Trumps Popularity

      In general GEO studies, Reddit and YouTube dominate. In fintech, they’re barely present:

      • Reddit: 1.14% of citations
      • YouTube: 1.07% of citations

      For perspective: a single press release wire (PRNewswire at 1.25%) generated more AI citations than both combined.

      Generic platforms fared even worse:

      • Medium: 0.27%
      • Wikipedia: 0.21%
      • Quora: 0.13%

      Bottom line: When AI explains financial infrastructure, it doesn’t crowdsource from Redditors.

      Source titleFrequencyShare of all supports
      Search result2,17732.28%
      prnewswire.com841.25%
      reddit.com771.14%
      youtube.com721.07%
      checkbook.io640.95%
      spreedly.com580.86%
      g2.com570.85%
      personetics.com540.80%
      auditoria.ai540.80%
      businesswire.com520.77%

      Where Gemini Actually Looks

      1. It trusts itself first (32% of citations)
      The largest source was “Search result” meta-citations, confirming Gemini runs multiple background queries before answering. This makes your own website’s clarity more critical than ever.

      2. It trusts specialists (the long tail)

      First-Party Sources (your website): Company domains (checkout.com, wealthfront.com, stripe.com) appear frequently. AI goes straight to the source—if that source is clear and comprehensive.

      Vertical Media & Analysts: Fintech Futures, PYMNTS, Gartner, and industry analysts hold significant sway.

      B2B Review Platforms: G2, Trustpilot, and SourceForge feed AI recommendations with structured comparison data.

      The Strategic Pivot for Fintech Marketers

      Stop chasing the Reddit dragon. It’s low-leverage for fintech queries.

      Instead:

      1. Make Your Website an AI-Ready Knowledge Base

      • Publish detailed technical specifications with schema markup
      • Create comparison pages that differentiate you from 3-5 competitors
      • Update core pages quarterly (freshness signals matter)

      2. Target the Fintech Press That AI Actually Reads

      Digital PR should focus on:

      • Industry analysts (Gartner, Forrester)
      • Vertical publications (Fintech Futures, PYMNTS, The Financial Brand)
      • Podcasts and video interviews (transcripts become training data)

      3. Own Your Review Platform Presence

      G2 and Trustpilot aren’t just lead gen—they’re AI training data. Ensure your profiles are:

      • Complete with technical specs
      • Updated with recent customer reviews
      • Rich with category-specific tags

      4. Create Machine-Readable Differentiation

      AI can’t infer what you don’t state explicitly. Publish content that says:

      • “We’re the only [category] that [unique capability] for [specific customer]”
      • “Unlike [competitor], we [specific technical difference]”

      In fintech GEO, leverage doesn’t come from content volume. It comes from being the undeniable authority in the specific places AI looks for credible data.

      Your competitors are wasting time on Reddit. You can own the sources that actually matter.

      Methodology note: While our study focused on B2B fintech infrastructure, these principles apply across fintech verticals where accuracy and authority matter more than popularity.