Category: Answer Engine Optimization

Uses the primary industry term to capture “Top of Funnel” authority queries.

  • What Are Generative Engine Optimization Tools? A Direct Answer

    Generative engine optimization (GEO) tools are software platforms that help brands track, measure, and improve their visibility within AI-powered search engines such as ChatGPT, Google AI Mode, Perplexity, and Gemini. Unlike traditional SEO tools that focus on keyword rankings in blue-link results, GEO tools monitor whether your brand is cited, mentioned, or summarized in AI-generated responses. They typically offer features including AI citation tracking, prompt-specific monitoring, brand sentiment analysis, competitor benchmarking, and content optimization recommendations designed to increase how often AI systems reference your content.

    Search is no longer just a ranked list. It is a synthesized answer. AI engines stitch together fragments from across the web and respond directly to user queries. GEO tools exist to help marketers understand, measure, and influence that process.


    Key Insights Summary

    • GEO is a fast-growing discipline. Search volume for “generative engine optimization tools” has grown nearly 327% in trend velocity, reflecting rapid market adoption as AI search reshapes how users discover brands.
    • Monitoring AI citations is the core use case. Every major GEO platform reviewed — including Semrush, Profound, Writesonic, and Otterly — centers its feature set around tracking when and how AI engines cite your brand.
    • The tool landscape is already crowded. Semrush has catalogued 10 leading GEO tools, while Writesonic lists 16 platforms worth evaluating, signaling a maturing but fragmented market.
    • Use cases differ significantly by company size. Enterprise teams need scale, integrations, and multi-prompt tracking. SMBs and agencies need affordability, ease of use, and white-label reporting.
    • Content quality and authority remain the underlying lever. GEO tools can diagnose visibility gaps, but improving citations still requires publishing authoritative, well-structured content that AI systems want to synthesize.
    • The category is evolving rapidly. SE Ranking’s Visible platform predicts significant shifts in GEO tooling through 2026–2027, including deeper integration with brand reputation and demand-generation workflows.

    Deep Explanation of Generative Engine Optimization Tools

    Why GEO Tools Exist

    Traditional search engines return a list of URLs. AI search engines – ChatGPT Search, Perplexity, Google AI Mode, and Gemini — return structured, conversational answers that synthesize information from multiple sources. In this model, appearing at position one means nothing if the AI does not cite your content at all. Brands that go unmentioned in AI responses effectively become invisible to a growing segment of searchers.

    As Writesonic explains, AI engines “synthesize, cite and summarize from across the web, pulling fragments of your content into AI answers.” Appearing in those answers has become a new metric of visibility — one that standard analytics platforms and rank trackers cannot measure. GEO tools fill that gap.

    Core Capabilities of GEO Platforms

    While each platform differentiates on specific features, the leading GEO tools share a common capability stack:

    • AI citation and mention tracking: Automatically querying AI engines with target prompts and logging whether your brand appears in the generated response, where it appears, and how it is described.
    • Prompt library management: Building and managing the set of prompts that matter most to your business — typically questions your target customers would ask an AI assistant.
    • Competitor benchmarking: Measuring how often competitor brands appear in AI answers for the same prompts, revealing share-of-voice in AI search.
    • Brand sentiment analysis: Assessing whether AI engines describe your brand positively, negatively, or neutrally, and flagging narrative drift.
    • Content recommendations: Identifying which content gaps or structural weaknesses are preventing your pages from being cited, and suggesting improvements.
    • Alerting and reporting: Notifying teams when brand mentions change and providing dashboards for stakeholders and clients.

    How AI Search Changes the Optimization Game

    In traditional SEO, the algorithm evaluates on-page signals like keywords, backlinks, and page speed to rank URLs. In generative AI search, the model evaluates the credibility, clarity, and relevance of content at the moment of response generation. This means GEO success depends on factors including topical authority, citation by trustworthy third-party sources, structured data, and the overall brand footprint across the web — not just on-site optimizations alone.

    AthenaHQ notes that as AI engines like ChatGPT, Perplexity, and Google’s SGE transform the search landscape, maintaining visibility requires a fundamentally different approach to how content is structured, distributed, and earned.

    The Relationship Between GEO and SEO

    GEO does not replace SEO — it extends it. Research cited by Writesonic found that 40.58% of AI citations come from Google’s top 10 results, which means traditional search authority still feeds AI visibility. However, ranking highly does not guarantee citation; content structure, clarity, and perceived authority all play independent roles. GEO tools help teams understand where they stand on both dimensions.


    Step-by-Step: Implementing Generative Engine Optimization Tools

    Step 1: Audit Your Current AI Visibility Baseline

    Before selecting a tool, manually query the AI engines your audience uses most — ChatGPT, Perplexity, Google AI Mode — with the top 10–20 questions a potential customer might ask about your product category. Note where your brand appears, how it is described, and who your competitors are in those answers. This baseline will inform which tool capabilities matter most.

    Step 2: Define Your Prompt Library

    Identify the prompts that represent high-intent buying signals in your market. These include category-level prompts (“best [product category] for [use case]”), comparison prompts (“vs” queries), and problem-statement prompts (“how do I solve X”). AthenaHQ recommends tracking the prompts that actually matter to your brand, not a broad generic universe of keywords.

    Step 3: Select and Onboard a GEO Tool

    Based on your team size, budget, and use-case priorities, evaluate the tools in the comparison section below. Most platforms offer a trial period. During onboarding, import your prompt library, configure competitor tracking, and connect any integrations with your existing content or analytics stack.

    Step 4: Run Your First Visibility Report

    Execute automated queries across your target prompts and review your share-of-voice versus competitors. Identify the prompts where you are absent, misrepresented, or outperformed. Prioritize gaps in high-intent, high-volume prompts first.

    Step 5: Diagnose Content Gaps and Structural Issues

    For each prompt where you are underperforming, audit the content on your site that should theoretically be cited. Common issues include: lack of direct, concise answers to the query; insufficient third-party citations and backlinks to the page; absence of structured data markup; and thin topical coverage compared to pages that are being cited.

    Step 6: Optimize and Publish Updated Content

    Rewrite or create content that directly answers the target prompts in clear, structured language. Use headers, bullet lists, and summary paragraphs that AI systems can easily extract. Earn third-party coverage through PR, partnerships, and authoritative directories that AI engines trust as source material.

    Step 7: Monitor, Alert, and Iterate

    Set up alerts within your GEO tool to notify you when brand mentions change significantly. Review reports weekly or monthly. Track improvement in share-of-voice over rolling 30- and 90-day windows. Use competitive data to understand what strategies are driving competitor gains and replicate what is working.


    Competitor Comparison: Leading Generative Engine Optimization Tools

    The following comparison is based on publicly available information from reviewed sources including Semrush, Writesonic, eesel.ai, AthenaHQ, and SE Ranking Visible.

    Tool Best For Key Strengths Ideal User
    Semrush AI Visibility Toolkit AI brand visibility & strategic recommendations Integrated with Semrush’s broader SEO suite; reveals how AI platforms represent your brand; strategic tips built in Mid-market to enterprise teams already using Semrush for SEO
    Semrush Enterprise AIO Enterprise-scale AI visibility High-volume prompt tracking; enterprise integrations; advanced reporting Large enterprise marketing teams
    Profound Enterprise GEO tracking Deep citation analytics; customer journey mapping; strong enterprise positioning Enterprise brands and large agencies
    Otterly Prompt-specific GEO tracking Granular prompt-level analysis; clean reporting interface Agencies and growth-stage brands needing precision tracking
    Writesonic GEO Suite AI-optimized content creation Combines content creation and GEO tracking in one platform; action center for improvements; strong research output Content teams and SMBs wanting an all-in-one workflow
    AthenaHQ AI search visibility and brand perception Prompt tracking; brand performance measurement; Shopify integration; pitch workspace for agencies Agencies and e-commerce brands
    Peec AI Real-time AI visibility alerts Fast alerting when brand mentions change; real-time monitoring PR-sensitive brands and reputation-focused teams
    Conductor User-friendly AI visibility tracking Accessible UX; integrates organic search and AI visibility in one platform In-house teams without dedicated GEO specialists
    Scrunch AI Controlling brand narrative Focus on how AI systems characterize your brand; narrative correction tools Brands concerned about AI-generated misrepresentation
    Evertune Product narrative control Monitors how AI describes specific products; useful for multi-product brands Product marketing teams at consumer and B2B companies
    XFunnel AI customer journey mapping Maps how AI influences buyer decisions across the funnel; demand-gen alignment Revenue-focused teams connecting AI visibility to pipeline
    SE Ranking Visible AI search visibility for agencies Agency-focused reporting; brand perception tracking; citation monitoring SEO agencies scaling AI search services for clients

    How the Platforms Were Evaluated by Reviewers

    Semrush’s review evaluated tools on their ability to monitor LLM mentions, analyze competitors, and provide actionable guidance for improving AI presence. eesel.ai’s comparison focused on feature breadth and pricing accessibility. SE Ranking Visible weighted tools on their ability to help brands make smarter business decisions and protect brand reputation in AI-generated narratives. Writesonic assessed 16 platforms on citation tracking, benchmarking, and content action capabilities.


    FAQ: Generative Engine Optimization Tools

    What is a generative engine optimization tool?

    A generative engine optimization tool is a software platform that tracks, measures, and helps improve a brand’s visibility in AI-generated search responses. These tools automate the process of querying AI engines like ChatGPT, Perplexity, Google AI Mode, and Gemini with target prompts, then recording whether and how your brand is cited, mentioned, or described in those responses. They provide dashboards, alerts, competitor benchmarking, and content recommendations to help marketing teams grow their share-of-voice in AI search. As Semrush defines it, GEO tools “provide insights into your brand’s visibility in AI search engines like ChatGPT and features like Google’s AI Mode.”

    How should teams evaluate generative engine optimization tools?

    Teams should evaluate GEO tools across five key dimensions:

    • Coverage of AI platforms: Does the tool monitor the specific AI engines your audience uses — ChatGPT, Perplexity, Google AI Mode, Gemini? Not all tools cover all platforms equally.
    • Prompt library depth: Can you build and manage a large library of prompts relevant to your business, or are you limited to a small preset list?
    • Competitor benchmarking quality: How clearly does the tool show your share-of-voice relative to named competitors across different prompt types?
    • Actionability: Does the tool stop at reporting, or does it provide specific content recommendations and optimization guidance? Writesonic’s GEO Suite and AthenaHQ both offer action-oriented features beyond pure monitoring.
    • Integration and reporting fit: Does the tool integrate with your existing analytics stack, and can it generate client-ready reports if you are an agency? SE Ranking Visible emphasizes agency scalability as a core evaluation criterion.

    Teams should also consider pricing relative to the number of prompts tracked and the frequency of data refreshes, as these factors heavily affect cost at scale.

    What mistakes should teams avoid with generative engine optimization tools?

    Several common mistakes reduce the effectiveness of GEO tools and the programs built around them:

    • Tracking too few prompts: Monitoring only branded queries misses the category-level and problem-statement prompts where competitors win new customers. Build a prompt library that mirrors the full customer decision journey.
    • Treating GEO as independent from SEO: Research shows that a significant share of AI citations originate from pages that already rank well in traditional search. Abandoning SEO fundamentals in favor of GEO-only tactics weakens both channels.
    • Ignoring third-party source building: AI engines cite authoritative sources. If your brand lacks coverage on high-authority publications, review sites, and relevant communities, no amount of on-site optimization will close the gap. PR and digital authority building remain essential inputs.
    • Measuring citations without measuring sentiment: Being cited negatively or inaccurately is worse than not being cited at all. Tools like Scrunch and Peec AI specifically address brand narrative control, which is an underused capability in most GEO programs.
    • Setting up the tool and doing nothing with the data: GEO tools generate insights, but they require a content and PR response to produce results. Teams that treat these platforms as passive dashboards without acting on recommendations will see little improvement in AI visibility.
    • Choosing a tool based on price alone: The cheapest option may not cover the AI platforms most relevant to your audience or may refresh data infrequently, leading to stale insights that drive poor decisions.

    Are GEO tools only for large enterprises?

    No. While some platforms like Profound and Semrush Enterprise AIO are designed for large-scale deployments, tools like Otterly and Writesonic GEO Suite are accessible to smaller teams and individual marketers. The key is matching the tool’s prompt volume limits, pricing model, and feature set to the actual scale of your program. Many platforms offer free trials or starter tiers that allow SMBs to begin measuring AI visibility before committing to a full subscription.

    How quickly can a brand expect to see results from GEO efforts?

    GEO improvements are typically slower to materialize than paid campaign results but can be faster than traditional SEO link-building timelines. Content that is newly published or updated may begin appearing in AI citations within weeks if it is authoritative, clearly structured, and indexed by the AI engines. Building third-party coverage and brand authority is a longer-term effort measured in months. Teams should set realistic expectations and use their GEO tool’s baseline data to track incremental progress on a monthly basis.
  • Positional Bias and Entity Extraction for AEO in SEO

    TL;DR: The Business Bottom Line

    Mastering AEO in SEO requires isolating the exact mathematical relationship between your native search rank and how generative engines extract your brand data.

    • The Core Reality: Ranking first on traditional search engine results pages guarantees the artificial intelligence models will ingest your factual data, but it mathematically fails to guarantee an explicit product recommendation.
    • The Revenue/Visibility Impact: Securing the top search position increases factual entity visibility by 4.3 percent over lower results, yet the explicit endorsement rate remains entirely flat across the top five search positions.
    • The Strategic Pivot: Marketing leaders must split their search strategy into distinct factual indexing and product endorsement tracks, shifting resources to secure placements within highly ranked software blogs over lower ranking legacy institutional sites.

    Note: The remainder of this report details the exact statistical methodology, causal inference models, and raw data used to reach these conclusions. It is written for data scientists, machine learning engineers, and technical search professionals.


    The Core Problem & Hypotheses

    As Generative AI systems mediate information retrieval, search visibility metrics require strict empirical reevaluation. We tested whether a high native search rank compels a Large Language Model to extract entities or recommend products at a higher frequency.

    We pre-registered and tested two formal hypotheses within a Google Vertex AI Search configuration:

    H2A (Factual Extraction): Generative AI architectures enforce a positional bias during extraction, such that $P(\text{extracted} \mid \text{Rank 1}) > P(\text{extracted} \mid \text{Rank } k)$, where $k$ represents lower ranked evidence.

    H2B (Recommendation Propensity): Entities sourced from Rank 1 hold a statistically higher probability of explicit recommendation, such that $P(\text{recommended} \mid \text{Rank 1}) > P(\text{recommended} \mid \text{Rank 3 to 5})$, controlling for source text brand density.

    Experimental Setup & Methodology

    Data aggregation relied on grounded conversational outputs across thousands of financial logic queries. To ensure tracking accuracy, we enforced a strict Closed-World Assumption. The pipeline mapped evidence URLs to canonical domains and tracked only the entities strictly traceable to the provided grounding sources.

    We evaluated entity extraction using a robust four layer funnel to prevent false negatives:

    • Regex Matching: Exact string matching of brand names in the generated response.
    • spaCy NER: Implementation of the en_core_web_sm model with a custom EntityRuler injected with a specialized brand dictionary to capture ORG and PRODUCT classifications.
    • Dictionary Lookup: Mapping localized product strings back to their parent canonical domains.
    • LLM Implicit Extraction: A fallback evaluation using gemini-3.1-pro-preview to identify implicit non-named entity references based strictly on context.

    To prevent confounding variables where top pages simply repeat their brand names to manipulate extraction, we engineered a Position-Weighted Brand Density control.

    Mentions of an entity in the first 20% of the text received a 2.0x weight, and mentions in the top 50% received a 1.5x weight.

    Isolating the Variables: Our Statistical Approach

    We applied causal inference models to isolate the genuine effect of ranking position over simple correlation.

    We corrected all final outputs for multiple hypothesis testing using the Benjamini-Hochberg procedure.

    Statistical TestVariable IsolatedRationale for Selection
    Logistic RegressionPosition-Weighted Brand DensityResidualizes hit rates by modeling $P(\text{mentioned} \mid \text{rank, brand\_density, cluster, intent})$.
    Cluster-Aware Block PermutationQuery-Level VarianceShuffles rank labels strictly within identical query clusters to account for localized intent variance.
    Propensity Score Matching (PSM) & IPWCausal Effect of PositionIsolates the causal effect of search ranking position from confounding text variables.

    Key Empirical Findings for AEO in SEO

    Finding 1: The Positional Bias in Factual Extraction (H2A)

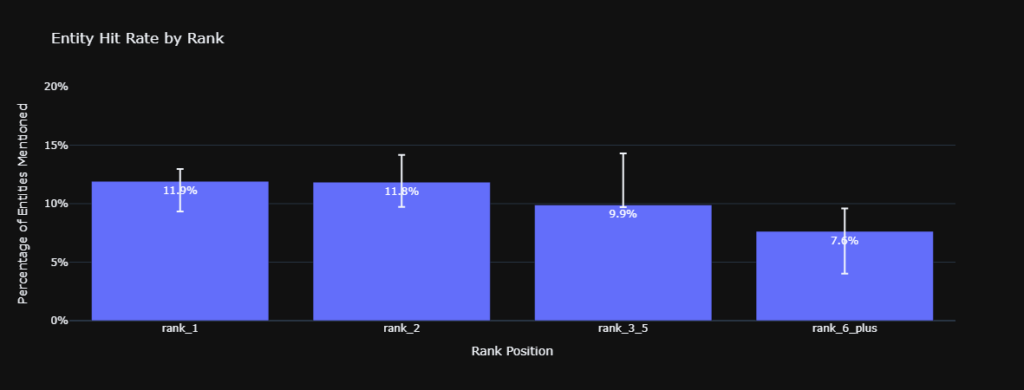
    Analysis of the raw and controlled entity hit rates confirms a severe rank gradient for factual ingestion. The raw hit rate for Rank 1 sources sits at 11.9% ($n = 1645$).

    This decays sequentially.

    Rank 2 sits at 11.8% ($n = 1233$), Rank 3 through 5 falls to 9.9% ($n = 1840$), and Rank 6 and above drops to 7.6% ($n = 720$).

    Applying the logistic control yields a 12.5% controlled hit rate for Rank 1 versus 8.5% for Rank 6 and above.

    The 95% Confidence Intervals for Rank 1 [9.3%, 12.9%] and Rank 6 and above [4.0%, 9.6%] do not overlap.

    This demonstrates robust statistical significance and supports H2A.

    Document level AEO in SEO entity hit rate by source rank bin demonstrating positional bias.
    Document-level Entity Hit Rate by Source Rank Bin. Error bars denote 95% Confidence Intervals for the sample means, demonstrating non-overlapping variance between top positions and lower tiers.

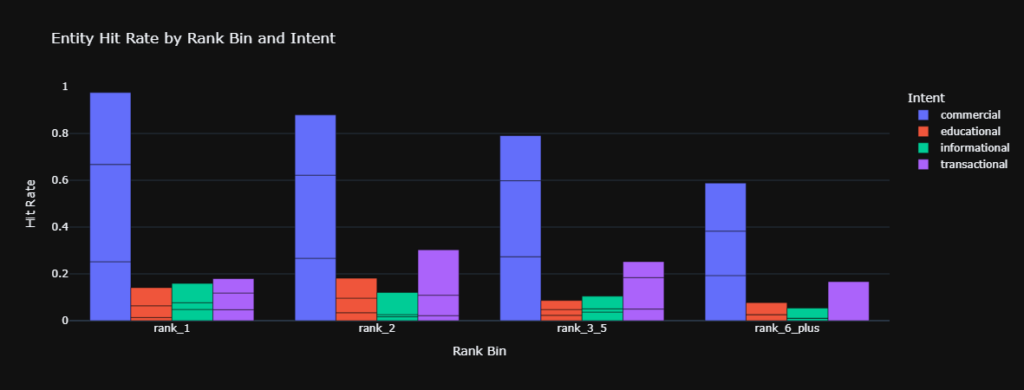
    Finding 2: Intent Context Alters Positional Bias for AEO in SEO

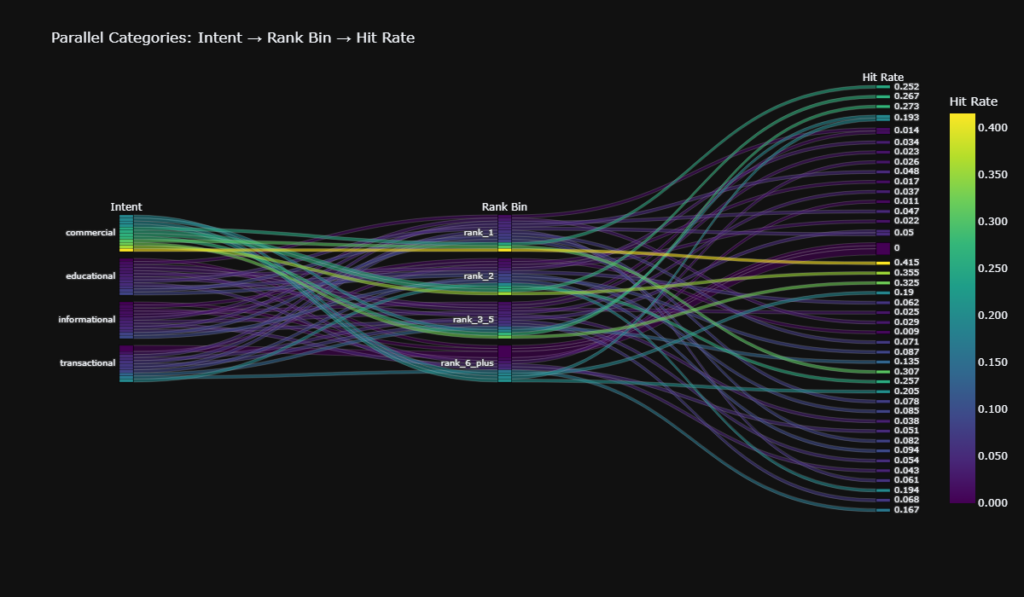
    Stratification of the dataset reveals that user intent contextually overrides positional bias. Within the commercial cash_flow cluster, Rank 1 achieved a 25.2% hit rate.

    However, Rank 2 achieved 26.6%, and Ranks 3 through 5 secured 27.3%. In high-value commercial evaluations, the LLM actively diversifies its sourcing across the primary search window, displaying contextual rank agnosticism.

    Grouped bar chart tracking AEO in SEO entity hit rate across rank bins stratified by user intent
    Grouped bar chart tracking Entity Hit Rate across Rank Bins, stratified by User Intent. The data illustrates how commercial intents disrupt the standard rank decay curve for AEO in SEO.
    Parallel categories plot visualizing commercial query flow and AEO in SEO extraction density.
    Parallel Categories plot visualizing the commercial flow, depicting high density hit rates converging tightly across Ranks 1 through 5

    Finding 3: The Decoupling of Recommendation Propensity (H2B)

    We utilized a zero-temperature LLM prompt requiring JSON output to map recommended entities to exact sections and text quotes.

    This tested whether factual extraction translates into explicit recommendation propensity for AEO in SEO.

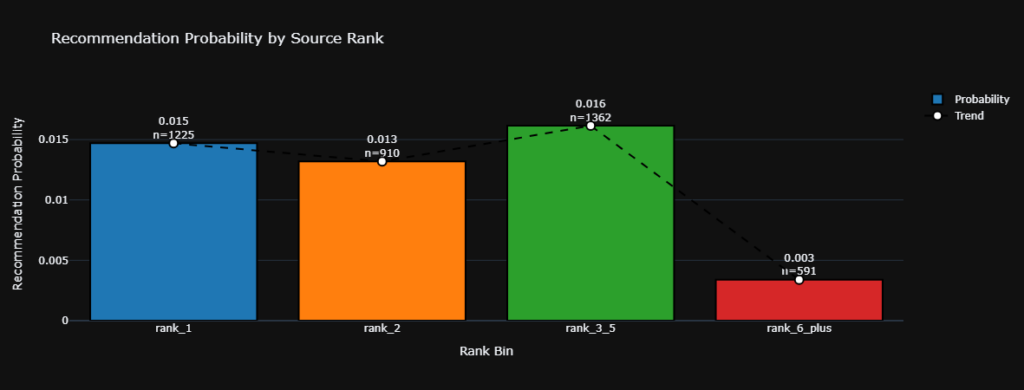
    The probability metric $P(\text{recommended} \mid \text{rank})$ is non-monotonic and structurally low:

    • Rank 1: 0.015 ($n = 1225$)
    • Rank 2: 0.013 ($n = 910$)
    • Rank 3 through 5: 0.016 ($n = 1362$)
    • Rank 6 and above: 0.003 ($n = 591$)

    A two-tailed T-test comparing Rank 1 and the Rank 3 through 5 cluster yielded a p-value of 0.571. This establishes no statistical difference. Search position does not reliably scale recommendation likelihood, meaning H2B is not supported.

    Recommendation probability by rank bar and scatter plot showing decoupling of rank and endorsement for AEO in SEO.
    Bar and scatter plot visualizing Recommendation Probability by Rank. The non-monotonic trend line illustrates the decoupling of search rank from the propensity to explicitly recommend an entity.

    Structural Impact

    The data exposes an Authority Erosion Effect native to LLM grounding mechanisms. The mean textual brand density measured 3.96 for Rank 1 sources, while Rank 6 and above sources exhibited the highest density at 4.31.

    A qualitative domain audit revealed Rank 1 is heavily populated by agile B2B software domains, whereas Rank 6 and above contains macro-financial institutions.

    Because the generative model enforces positional bias, it systematically ingests narratives from Rank 1 domains.

    This effectively circumvents the traditional extrinsic domain authority of the legacy institutions natively populating the lower ranks.

    Technical Glossary (Entity Mapping)

    • Closed-World Assumption: A strict data boundary premise where entity tracking is limited exclusively to the specific entities present within the provided grounding URLs.
    • Position-Weighted Brand Density: A statistical control metric that assigns mathematical weight multipliers to brand mentions based on their proximity to the beginning of a document.
    • Propensity Score Matching (PSM): A matching technique used to estimate the causal effect of a treatment by accounting for covariates that predict receiving the treatment.
    • Cluster-Aware Block Permutation: A variance control method that shuffles rank labels strictly within identical query clusters to isolate local intent effects.
    • Benjamini-Hochberg Procedure: A statistical method for controlling the false discovery rate during multiple hypothesis testing to ensure p-values reflect true significance.
    • Zero-Temperature Prompt: A deterministic Large Language Model parameter setting that forces the model to select the most probable token, eliminating creative variance during extraction.
    • Inverse Probability Weighting (IPW): A technique used to calculate statistics standardized to a pseudo-population to adjust for confounding variables in observational data.

    Frequently Asked Questions

    Q: How does search rank causally affect AEO in SEO?

    A: Search rank dictates the probability of factual extraction by generative models, creating a measurable mathematical bias toward the first position over lower results.

    Q: Does a top ranking statistically guarantee an AI brand recommendation?

    A: No, empirical data shows recommendation probability remains flat across ranks one through five, confirming a p-value of 0.571 and no statistical advantage.

    Q: What is the Authority Erosion Effect structurally?

    A: It is a phenomenon where generative models prioritize factual extraction from highly optimized software domains ranking first, circumventing the native authority of lower ranking legacy institutions.

    Q: Why did the study calculate position-weighted brand density?

    A: This metric controls for confounding variables where top ranking pages might artificially inflate their extraction rates by repeating their brand name more frequently than lower pages.

    Q: How do commercial intents alter baseline entity extraction rates?

    A: High-value commercial queries cause the language model to diversify its context window, flattening the positional bias across the top five search results.

    Q: What does a p-value of 0.571 prove regarding recommendation propensity?

    A: It confirms that the minor variances in recommendation rates between the first position and positions three through five are strictly due to random chance, not rank position.

      Conclusion

      The empirical data confirms that generative retrieval architectures actively enforce a positional bias during factual extraction, granting a statistically significant advantage to Rank 1 sources. However, rigorous causal inference testing reveals this positional bias fails to cascade into recommendation propensity. Search rank serves strictly as a gatekeeper for factual entity ingestion, operating completely independently of the underlying mathematical logic the model utilizes for explicit brand endorsement.

      Kojable

      Kojable tracks how artificial intelligence models cite brands across different user personas and commercial intent clusters. If you are optimizing for AI search, we can show you exactly how your content performs in live retrieval.

    1. The Answer Engine Optimization Rank 1 Myth

      TL;DR

      We studied 1500 generated answers to see how answer engine optimization works in reality. We found that securing the top source controls what the model writes first, but it does not force identical outputs. Winning top placement gets you credit without locking the artificial intelligence into a single narrative.

      The hypothesis

      Founders and marketing leaders need to know if holding the top spot forces the model to copy their exact story. We tested two main ideas to understand this behavior.

      Our first idea checked if answers sharing the top source look identical.

      Another idea tested if that top source controls specific sections inside the text.

      Why this matters

      Search is changing fast. Answer engine optimization focuses on getting your content understood and surfaced by artificial intelligence. Generative engine optimisation improves your representation inside chat answers.

      A system connects an external database to the language model so it can retrieve facts before writing. You will miss what actually drives the output if your tracking software only looks at link placement.

      Data science helps us separate who gets cited from what the user eventually sees.

      The methodology

      We built a dataset of 1500 generated responses. These responses contained 3797 grounding rows from 1171 unique sources. Our team split every generated answer into smaller sections. We then divided the original sources into text chunks.

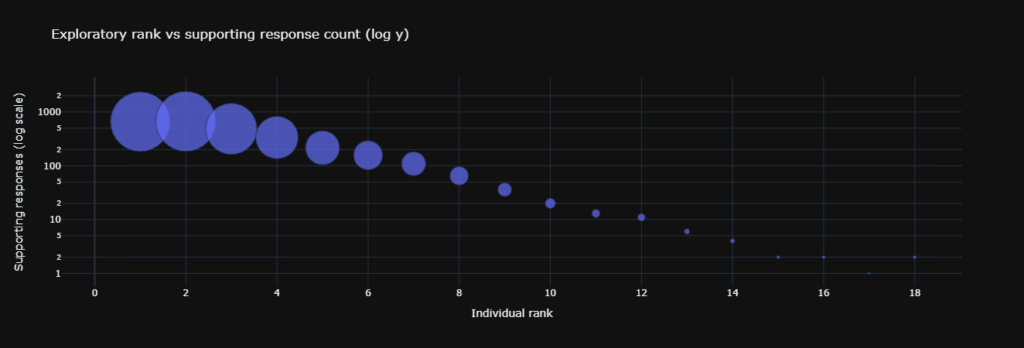
      The researchers embedded both parts and matched the sections to the closest chunks using mathematical distance. We tracked citation counts to see where the model paid attention. The top spot received 1171 citations, while the tenth spot only received 23 citations.

      Statistical approach

      Our team used bootstrap confidence intervals with 2000 resamples. This method estimates uncertainty without assuming our data follows a normal curve. Researchers also ran permutation tests with 3000 shuffles.

      This created a clean baseline to show what happens if we mix up all the source labels randomly. The final report included the effect size so your business decisions rely on actual impact rather than simple probability scores.

      Key findings

      The first test showed no support for identical outputs.

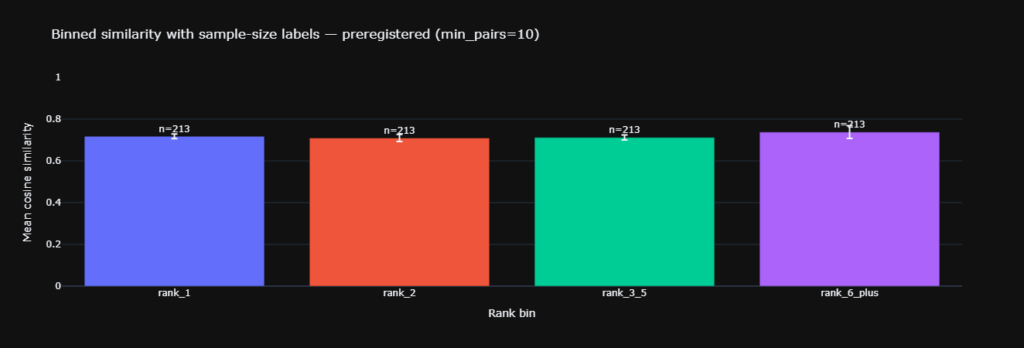
      1. Similarity scored 0.717 for the top shared pairs and 0.712 for lower shared pairs.

      Bar chart with Rank 1 and Rank 3 to 5 bars at nearly the same height illustrating answer engine optimization.
      Cross response similarity stays almost flat across shared source rank bins.

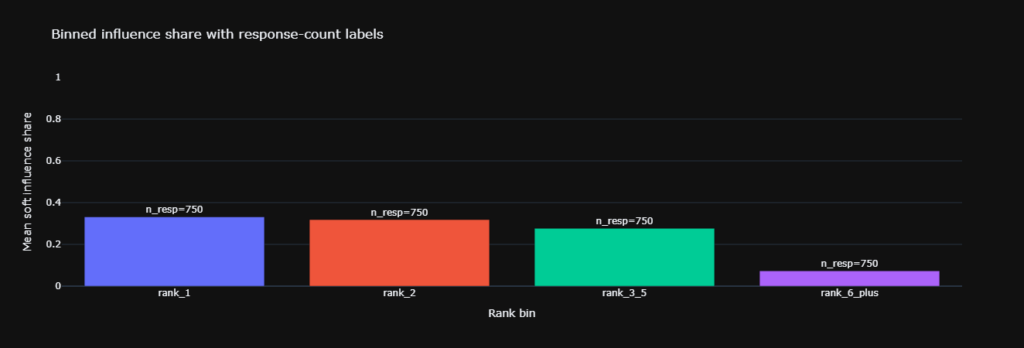
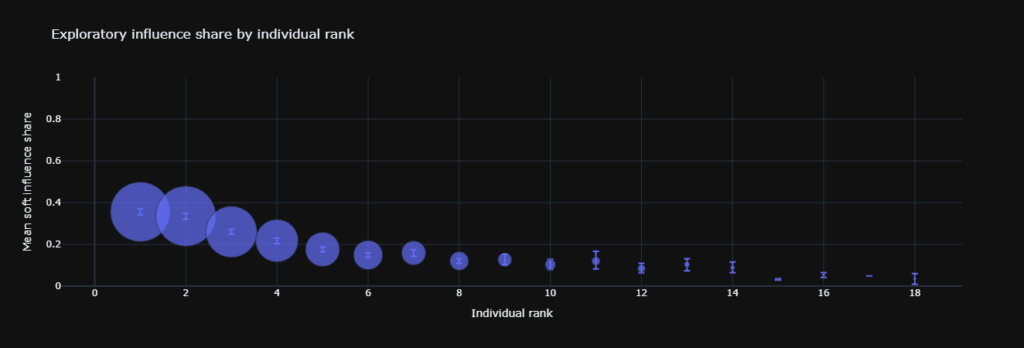
      2. The second test proved the top source dominates internal sections. Top influence share reached 0.38 compared to a 0.25 baseline.

      Bar chart where Rank 1 is tallest and Rank 6 plus is smallest showing answer engine optimization impact.
      Within one answer Rank 1 wins a larger share of section influence than any other bin.

      3. Top influence drops significantly as you move down the list.

      Scatter plot with larger points at low ranks and smaller points at high ranks for answer engine optimization analysis.
      Mean influence share declines as rank increases.

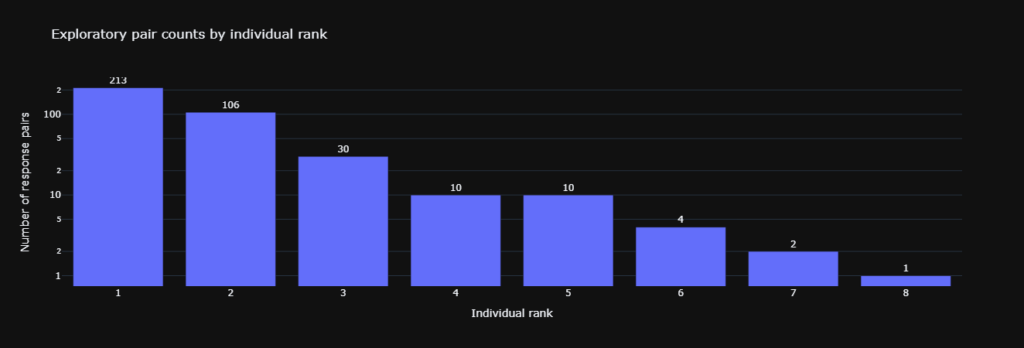
      4. The amount of available data falls fast beyond the first few positions.

      Bar chart with a tall bar at Rank 1 and much shorter bars by Rank 8.
      The number of response pairs per shared rank drops sharply after the first few ranks.

      5. Citation counts show a steep drop in model attention.

      Bubble chart on a log scale where bubbles shrink as rank increases.
      Supporting response counts drop as rank increases showing top heavy citing behavior.

      Impact on results

      Looking only at citation counts makes you think this process is just a simple race to the top. Influence share metrics and shuffle tests change that perspective completely. The top spot dominates the internal structure of the text.

      However, that shared source does not make the final answers converge across different prompts. This provides a cleaner way to evaluate artificial intelligence behavior.

      We can finally separate internal attribution from external similarity.

      What this means for you

      You should aim for the top position whenever possible. That first spot tends to anchor the early sections of the generated text. Teams must also cover the next few positions with specific pages.

      The model blends multiple sources together so cross answer similarity stays diverse. Use data science to track influence share by web address.

      Tune your AEO tool to report both retrieval rate and section influence. Add intent mapping to your testing process.

      Check which intents show up as influential chunks across the final output.

      Key Terms Glossary

      • Cosine similarity is a score that measures how close two embedding vectors point.
      • Bootstrap confidence interval is a range built by resampling the observed data many times.
      • Permutation test is a shuffle based test that compares the observed effect to effects from randomized labels.
      • Cohen d is an effect size that expresses mean differences in standard deviation units.
      • Null model is a baseline world used for comparison.

      Frequently asked questions

      FAQ 1

      Does the top spot make artificial intelligence answers the same.

      No, because similarity remains flat across different ranks.

      FAQ 2

      Does the top spot still matter for answer engine optimization.

      Yes, because it shapes many sections inside the generated text.

      FAQ 3

      What should my team measure in their tracking software.

      Track retrieval by position and influence share by web address.

      FAQ 4

      How do I explain this to a non technical team.

      The top source sets the opening and gets most of the credit, but the full answer still changes with the prompt.

      FAQ 5

      Where does intent mapping fit into this process.

      Use it to define the questions you want to own and measure if those intents appear in influential sections.

      Summary

      The top rank wins influence inside answers without forcing sameness, so your strategy should pair ranking work with section level measurement.

      Follow Kojable for more deep dives

    2. What G2 Data Reveals About the GEO/AEO Tool Landscape?

      I analyzed G2 data for 23 AEO platforms to see who is really buying, using, and reviewing these tools. Here’s what the numbers reveal about market saturation, persona dominance, and whitespace opportunities.

      1) Market segment: where the fight is hottest

      The Small-Business segment is crowded, with many competitors showing 60%+ SB concentration. Some vendors are entirely SB-dependent: Visby AI (91%), Hall (92%), AI clicks (88%), SE Ranking (89%), and even major names like Semrush (62%) and Ahrefs (62%).

      Implication: If you’re launching an AEO tool for small businesses, you’re entering the most saturated segment. To win, you need extreme ease-of-use (self-serve, zero onboarding), aggressive pricing (freemium or sub-$99/mo), or a hyper-specific niche like “AEO for local service businesses.” Generic “AI visibility for SMBs” won’t cut it.

      At the Enterprise end (35%+ concentration), fewer players compete, and a smaller group balances Enterprise/Mid-Market. This split creates distinct “lanes” (SMB-first, MM-first, Enterprise-first), each with different expectations for onboarding, security/compliance, reporting depth, and customer success.

      2) Personas: practitioners dominate, but execs are emerging

      The most frequently targeted roles skew toward SEO and marketing practitioners:

      • SEO Manager (5 vendors)
      • Marketing Manager (4 vendors)
      • Digital Marketing Manager / SEO Specialist (2 each)

      However, CEO/Founder/Owner appear as primary users for Profound, Visby AI, Ahrefs, and SE Ranking—suggesting these tools are either simple enough for non-specialists or packaged as high-level strategic reporting.

      Implication: Most platforms are built for doers (SEO teams executing daily). But there’s a second motion: dashboards so clean that a CEO can answer “Are we visible in AI search?” in 30 seconds. Serving both personas unlocks budget authority and daily stickiness. If your product requires expert workflows, lean into “built for practitioners.” If it’s narrative/visibility risk + decision support, position it as “built for leadership.”

      3) Industry focus: concentration creates whitespace

      70% of competitors focus on Marketing & Advertising (12 vendors), Computer Software (6 vendors), and IT Services (3 vendors). This density provides clear ICP fit but also creates opportunities where competitive noise is lower.

      Underserved industries:

      • Financial Services (only Yext)
      • Healthcare (only Yext)
      • Retail (3 vendors, not primary)
      • Consumer Services (only Conductor)

      Implication: An AEO platform specifically built for regulated industries (Finance, Healthcare, Legal) or product-heavy sectors (Retail, CPG) would face minimal direct competition. The wedge: “We understand your compliance needs / product catalog structure / seasonal volatility.”

      4) The biggest insight: a major data gap

      A meaningful portion of competitors have “No information available” for Users (and some for Industries). This creates strategic risk—conclusions about persona saturation and category positioning become biased toward companies with better-populated profiles.

      Action item: Fill these gaps with external research: product pages, case studies, job postings, sales decks, onboarding flows, customer logos, and review mining beyond G2 snapshots.

    3. AEO/GEO Pricing Intelligence: What You Can Afford to Pay

      A vendor manager’s guide to AI Search Optimization budgets, ROI thresholds, and platform selection


      The Bottom Line for Budget Owners

      If you’re managing AEO/GEO vendor selection, here’s your decision framework: Don’t pay more than you can justify in measurable search visibility ROI within 12 months.

      With platforms now competing across freemium to custom enterprise tiers, overpaying is a bigger risk than underpowering.

      Current Entry Floor: $39–$99/month
      ROI Justification Zone: $150–$399/month for most mid-market organizations
      Enterprise Threshold: $500+/month only if you have multi-brand complexity or compliance requirements


      Budget Tier Analysis: What You Get vs. What You Should Pay

      Tier 1: Proof-of-Concept / Solopreneur ($0–$99/month)

      Who should buy: Startups validating AEO need, individual consultants, agencies testing tools for client recommendations

      Price PointWhat to ExpectROI RealityExample Vendors
      Free–$491–2 AI engines, basic tracking, 1 projectBreak-even on time savings onlyAirOps (start for free),
      Hall Lite (free, 1 project), Geneo (free tier + Pro at $39.9),
      Geordy (entry usage-based credits)
      $50–$992–4 engines, 5–10 articles/month, competitor monitoringJustifiable if it saves 2–3 hours/week of manual search auditingWritesonic Lite ($49), Jasper Pro ($59),
      Cognizo Monitor ($89), Promptwatch Starter ($99),
      Profound Starter ($99),
      Scrunch Explorer ($100)

      Vendor Manager Play: Treat this as a trial tier. If a vendor can’t demonstrate measurable visibility lift within 60 days at this price, they won’t deliver at higher tiers.

      Red flag: Any platform without content generation bundled here will be obsolete by Q4 2026.

      Freemium Risk Warning: AirOps and Hall Lite offer unlimited free tiers—sustainable only if 5–10% convert to paid. If you’re staying on free forever, expect feature limits or sunsetting.


      Tier 2: Departmental Deployment ($150–$399/month)

      Who should buy: Marketing teams at $5M–$50M revenue companies, growth agencies managing 3+ clients

      This tier is the most saturated segment. Differentiation is non-technical (support quality, onboarding, agent features).

      Price PointJustification MathRisk AssessmentExample Vendors
      $150–$199Must deliver equivalent of 1–2 days/month of analyst time savings + measurable ranking improvementsHigh churn zone—vendors compete on features, not outcomesOtterly Standard ($189), AIclicks Pro ($189),
      Hall Starter ($199), Writesonic Professional ($249)
      $200–$299Should include content automation, multi-engine coverage, team collaboration (3+ seats)Sweet spot for ROI—platforms here have enough functionality to show real workflow impactPromptwatch Professional($249),
      $300–$399Requires either: (a) execution agents, (b) compliance features, or (c) agency-level multi-client managementIf it doesn’t include agents/automation, you’re overpayingGeordy Business ($399)
      Profound Growth ($399),
      Cognizo Optimize ($399),
      Open Forge Startups($349)

      Critical Insight: At $200–$299, switching costs become your friend. Once a team is trained and data is accumulated, migration pain exceeds the savings from downgrading to a $99 competitor. Negotiation leverage: Push for annual prepay discounts (typically 15–20%—Hall offers 16%, AIclicks 17%, Writesonic 20%).


      Tier 3: Enterprise / Multi-Brand ($500–$12,000+/month)

      Who should buy: Enterprise brands with complex governance, regulated industries, agencies managing 10+ clients

      Price PointWhen It’s JustifiedWhen It’s NotExample Vendors
      $500–$799Self-serve enterprise with unlimited seats, API access, custom reportingIf you need heavy customization but the vendor charges for “managed services” without delivering strategic valueTelepathic Pro ($475),
      AIclicks Business ($499),
      Scrunch Growth ($500),
      Promptwatch Business ($549),
      Share of Model ($799)
      $1,000–$3,499Custom integrations, dedicated success management, outcome-based pricingPure monitoring with a high price tag—platform features will commoditize this within 18 monthsOpen Forge Midmarket ($1,999),
      Yolondo Growth ($3,499)
      $3,499–$10,000+Done-for-you execution, guaranteed rankings, agency staffing augmentationYou’re paying for labor, not software—benchmark against hiring in-house talentOpen Forge Managed ($3,999),
      Alex Groberman Enterprise ($9,999),

      Vendor Manager Rule: Above $1,000/month, demand published case studies with comparable companies.

      Platforms like ChatRank, SaaSRank and Withgauge hide pricing—this creates procurement friction and often signals sales-driven complexity rather than value clarity.


      Pricing Model Selection for Procurement

      Your GTM StrategyBest Pricing ModelWhy It WorksVendors Using This Model
      Organic growth, limited budgetTransparent flat-ratePredictable costs, no overage surprises, easy budget approvalHall (16% annual discount),
      Cognizo (17%, 2 months free),
      Rapid scaling, uncertain usageFeature-led hybridFlexibility, but requires strict usage monitoring to avoid budget creepAIclicks (hybrid: engines + blogs + prompts), Writesonic (articles + seats + GEO), Promptwatch (sites + prompts + articles), Scrunch (users + prompts),
      ZipTie (searches + optimizations),
      Otterly (prompts + audits), Geordy (usage-based credits),
      Geneo (credit-based)
      Enterprise sales, complex requirementsCustom/Outcome-basedAligns vendor incentives with your results, but requires robust SLA definitionsOpen Forge Managed, Alex Groberman Labs, SaaSRank, Petra Labs, Share of Model, Withgauge, ChatRank

      Procurement Warning: Hybrid models often create “overage shock” at month-end.

      AIclicks, Writesonic, Promptwatch, Scrunch, and ZipTie all use multi-dimensional pricing—cap monthly spend or negotiate unlimited tiers if you have variable content needs.

      Geordy and Geneo use credit-based systems that require careful burn monitoring.


      ROI Calculation Framework for Vendor Managers

      Use this formula to determine your maximum justifiable spend:

      Monthly Platform Cost ≤ (Monthly Value of Time Saved) + (Estimated Revenue Impact from Visibility Gains)

      Component A: Time Savings Valuation

      • Manual AI search auditing: 4–8 hours/week for a mid-market brand
      • Loaded cost of marketing analyst: $75–$125/hour
      • Monthly value of automation: $1,200–$4,000

      Component B: Revenue Impact

      • Conservative: 5–10% increase in qualified organic traffic from AI search
      • Average B2B conversion rate: 2–3%
      • Average deal size: Calculate your own

      Example Calculation

      If a platform saves 6 hours/week of analyst time ($4,500/month value) and generates 2 additional qualified leads worth $5,000 each:

      Maximum Justifiable Cost: $4,500 + $10,000 = $14,500/month
      Rational Ceiling for AEO Platform: $500–$1,000 (you’re paying for software, not total value capture)


      Vendor Differentiation by Use Case

      Instead of repeating the same names, here’s how specific platforms carve out positioning:

      Use CaseExample VendorsWhy Them
      Content-heavy teamsWritesonic (40–100 articles), AIclicks (10–30 blogs), Promptwatch (5–30 articles)Quantity + quality of AI-generated content bundled
      Execution agents (auto-publishing)Telepathic (AI strategy agent),
      Open Forge (unlimited agent usage)
      Automation beyond monitoring
      Agency multi-client managementHall Business (50 projects), Scrunch Growth (5 users, 700 prompts),
      Promptwatch Scale (5 sites, 350 prompts)
      Seat scaling + project segmentation
      Startup-friendly entryGeneo ($39.9 affordable multi-brand),
      ZipTie Starter ($69)
      Low friction, growth-path clarity
      Enterprise service-heavyOpen Forge Managed,
      SaaSRank,
      Alex Groberman Labs,
      Petra Labs
      Done-for-you execution, but verify outcome guarantees

      Market Trajectory: Lock in Pricing Now

      2026 Forecast:

      Monitoring will become table stakes, differentiation will shift to execution agents.

      Strategic Recommendation:

      • If buying in Q1–Q2 2026: Lock annual contracts at current $150–$250 rates.
      • Platforms like Hall, AIclicks, and Writesonic offer 16–20% annual discounts—you won’t see lower mid-market prices, and feature expansion will make these tiers more valuable.
      • If evaluating vendors: Prioritize platforms with agent/automation roadmaps (Telepathic, and Open Forge). Pure monitoring plays (ChatRank, Peec.ai) will be commoditized within 18 months.
      • If managing existing contracts: Renegotiate any $500+ monitoring-only contracts immediately. That pricing reflects 2024 market conditions, not 2026 realities.

      What to Avoid (Across All Platforms)

      Don’t pay for:

      • Generic monitoring without content generation (below $300 tier).
      • Hidden pricing without clear ROI demonstrationWithgauge, Petra Labs all obscure costs; demand transparency or walk away
      • “Enterprise” features you can replicate with $50/month tools + Zapier

      Do pay for:

      • Execution agents that automate publishing/optimization (Telepathic, Open Forge)
      • Proven case studies in your exact company size/category

      The 2026 AEO market is a buyer’s market below $300 and a value-validation challenge above $500.

      With 195+ platforms competing, you have leverage—use it to lock in rates before the next pricing compression cycle.